Custom reports
The Nicoka Reports module lets you build your own tables and charts from your data (candidates, applications, jobs, employees, invoices…), share them with your team and display them as widgets on your dashboard.
The ready-to-use reports on your jobs (Performance Analysis, analysis by source, average time per step…) are presented in a dedicated article: Reports related to missions / offers / jobs.
The Reports menu
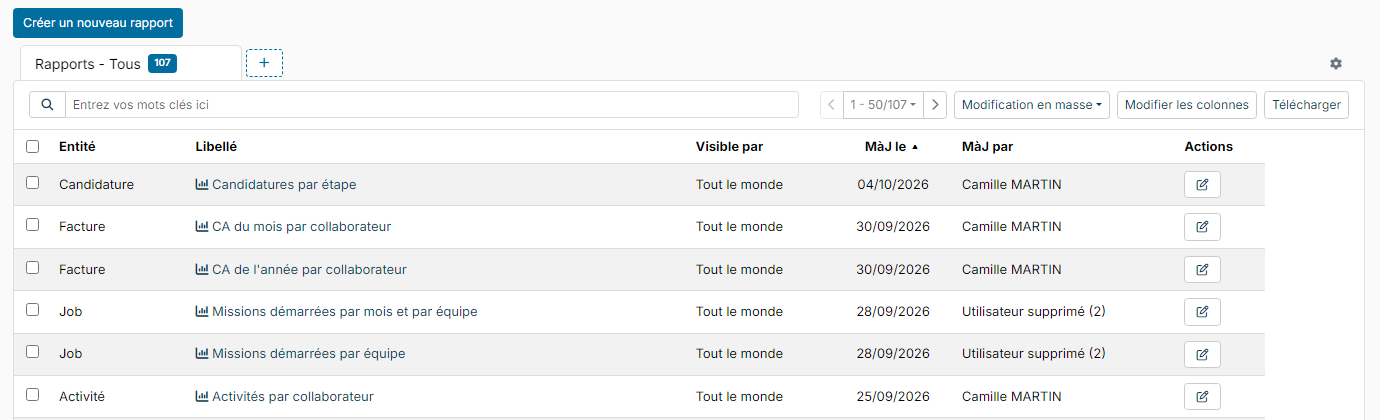
In the side menu, click Reports. The list shows the reports you have access to, with their entity, their visibility and their update date. Click a report's label to display it, or the pencil in the Actions column to edit it.
Create a report
Click Create a new Report, then fill in the three blocks of the page:
- Type: the form of the report.
- Table: detailed rows and columns, which can be exported;
- Pie Chart: a breakdown in percentages;
- Bar Chart: values compared by category;
- Line Chart: a trend over time;
- Periodical: one period compared with another;
- KPI: a key figure to follow.
- Entity: the data the report starts from, grouped by module (for example Candidate, Candidate Application, Job, Action for the ATS). The list depends on the modules active in your workspace; the search field filters it.
- Detail: the Label, an optional Description and Visible by: Everybody, Me or Only some people (chosen departments, companies, profiles or people).
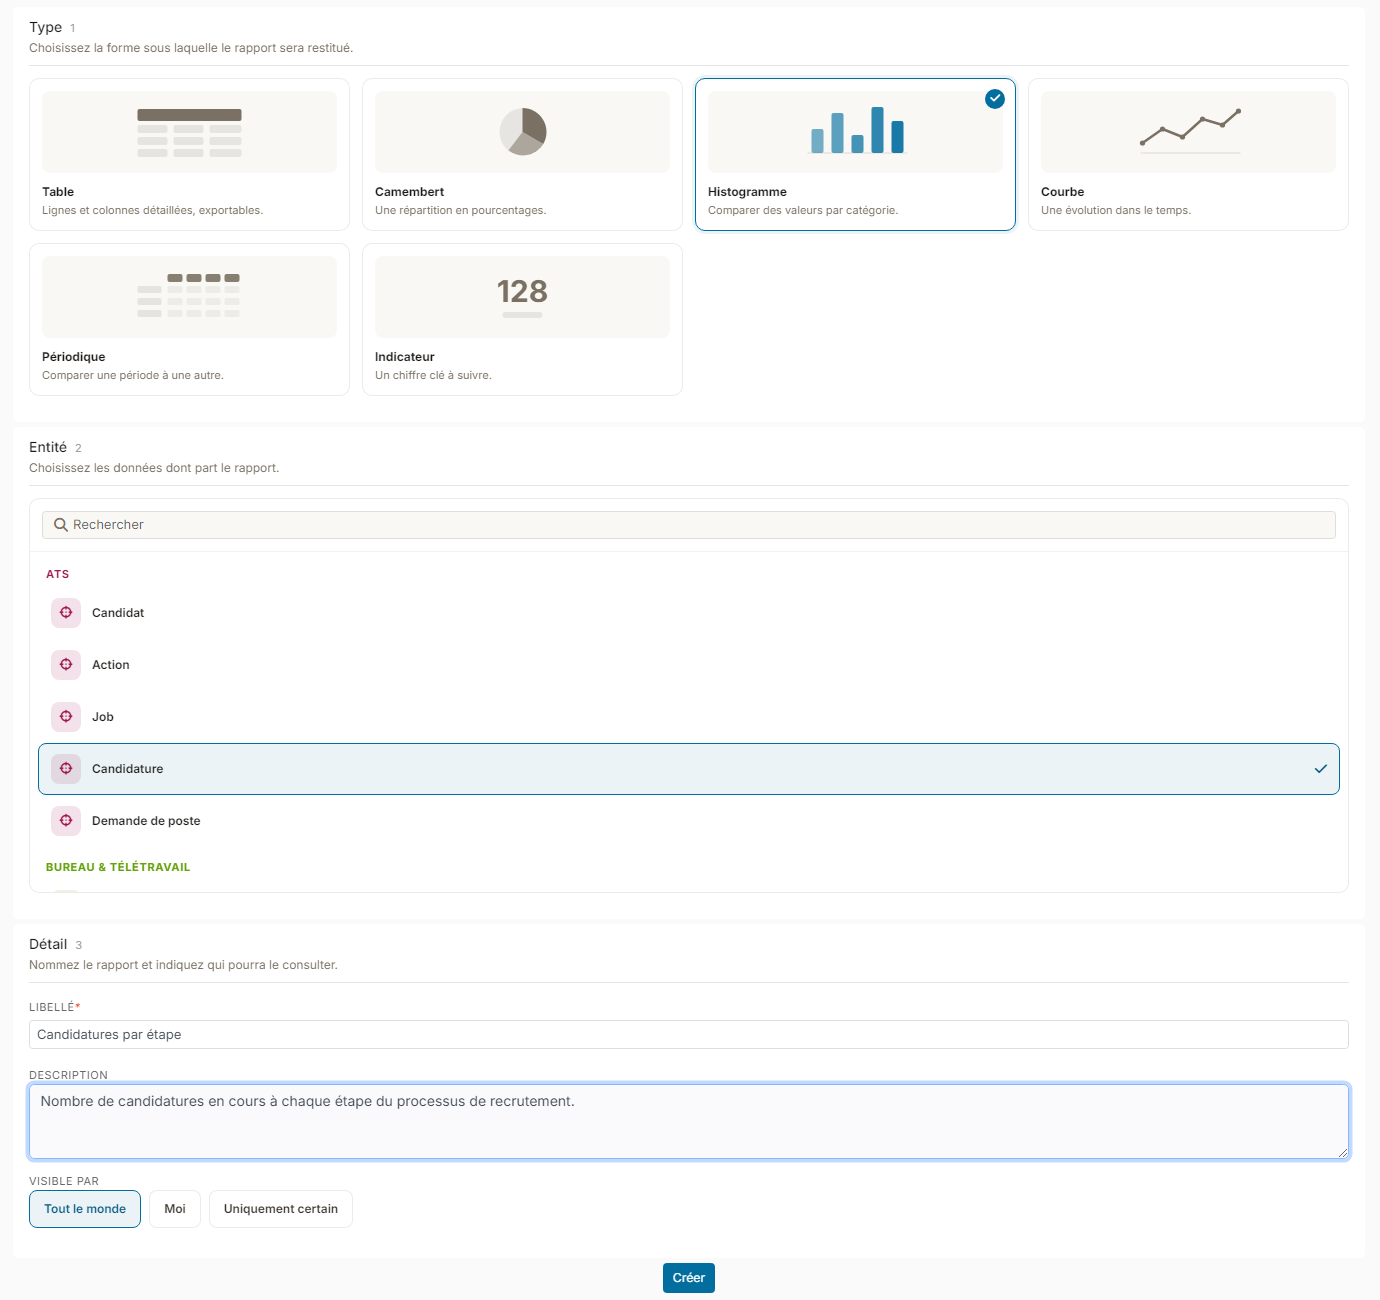
Click Create. The report's edit page opens for the setup. The type and the entity can no longer be changed afterwards: to change them, create another report.
Set up the report
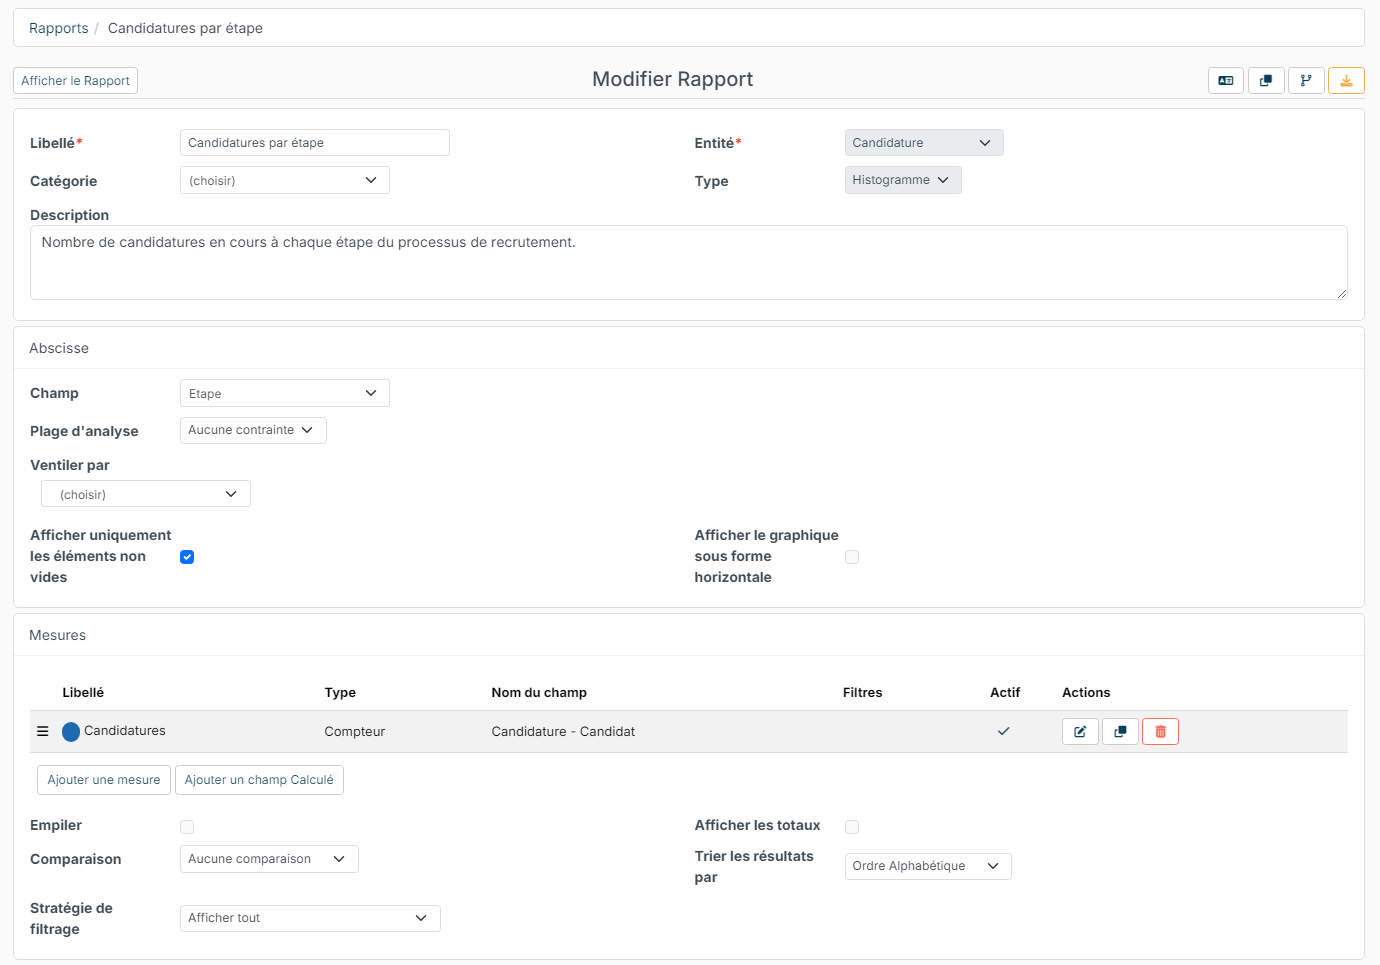
The blocks offered depend on the type of report. For a bar chart or a line chart:
- X - Axis: the field that forms the categories (for a line chart, a date field), the Analysis range (a unit, days, week, month, quarter or year, and a period: current, previous, last 3, 6 or 12…) with the date field it applies to (Base on), and Ventilate by to split each category by a second field. The Only show not empty box hides the categories with no value.
- Measures: what you count or add up. Click Add a measure (see below) or Add a calculated field for a formula based on other measures. You also set the stacking, the Comparison with the previous year or period, the display of totals, the sort order and the Filtering Strategy (show all, or only the highest or lowest values).
- Filters: click Add a filter to restrict the data (for example the jobs in progress). Add an alternative block of filters adds a second set of conditions, as an alternative to the first.
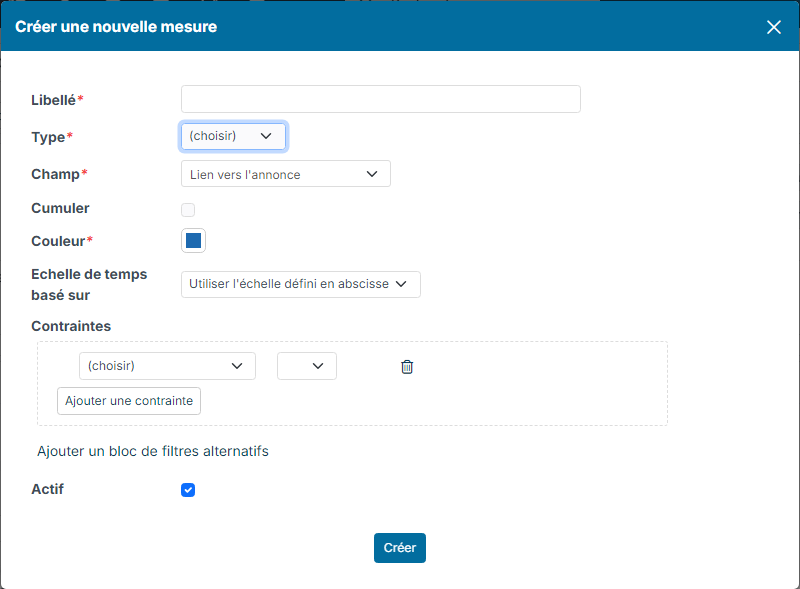
In a measure's window, fill in the Label, the Type (Count, Sum, Average, Min or Max), the field concerned and the Color. The Constraints limit the measure to some data, for example the applications from a given source. Untick Active to hide the measure without deleting it.
The other types follow the same principle:
- Pie Chart: a Field to analyse and a single measure;
- Table: the Choosen fields, which you order by drag and drop, calculated fields, the sorting, the maximum number of results, the total and the grouping;
- KPI and Periodical: one or more measures, each with its own constraints.
Click Update, at the bottom of the page, to save, then use the button at the top left to display the report and see the result.
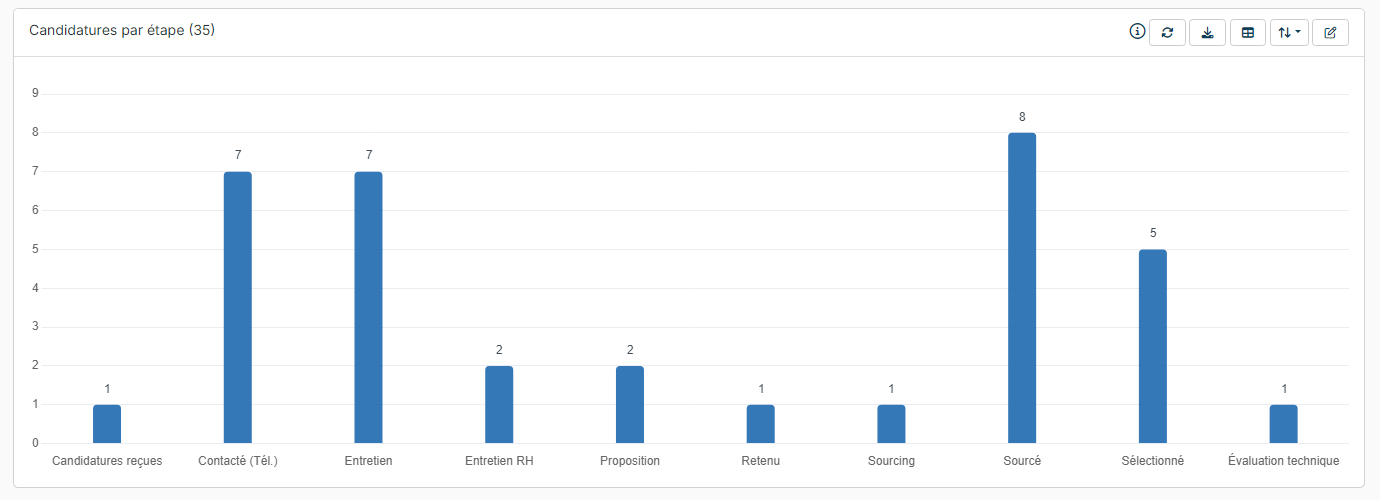
From the displayed report, the buttons at the top right let you refresh it, download it in Excel format and go back to its setup (pencil).
Create a report from another one
To adapt an existing report (for example the same analysis on another year), open it for editing, then click the copy icon at the top right of the edit page. Nicoka creates a copy that you can adapt freely.
Display the report as a widget
- On the report's edit page, in the Options block, tick Available as a widget, then click Update.

- On your dashboard, click +: in the window that opens, the Report Base category gathers the reports available as widgets. Click the one you want to add.
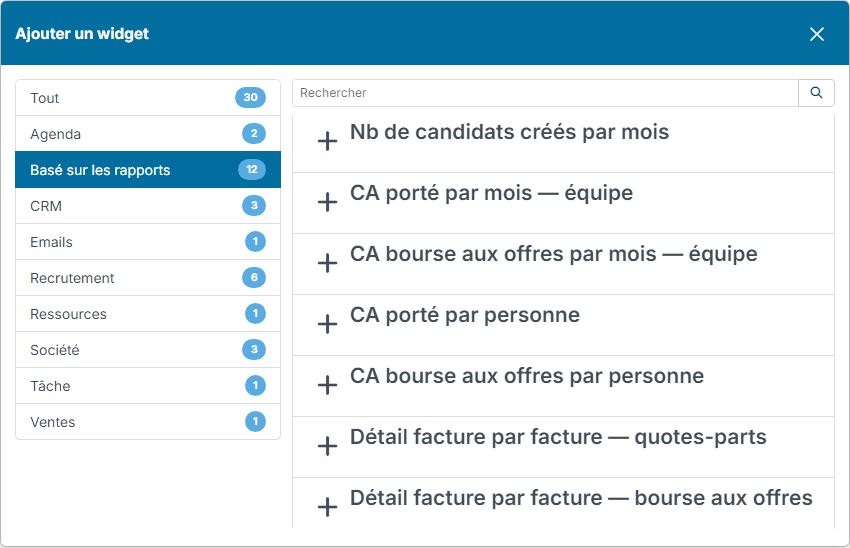
The widget is offered to the people who can see the report (Visible by setting). A copy of a report is not available as a widget until you tick the box. To organize your dashboard, see Dashboard - Customization.